Chapter 9 Reports
Odoo natively provides two common types of reporting capabilities. The first type is printable PDF documents for customers or internal archive, such as quotations, invoices, and delivery slips. The second type is analytical reports inside the system, such as sales analysis, purchase statistics, inventory analysis, aged receivables, pivot tables, and charts.
When many companies first use Odoo, they understand "reports" as rebuilding every old system or Excel report. This is usually not the best path. Odoo is better used by first relying on native reports, filters, groups, favorites, exports, pivot views, and charts to clarify data definitions, then deciding whether a few truly valuable reports need customization. This chapter explains how to use native Odoo reporting and why native solutions are usually more stable, cheaper, and easier to upgrade.
First Distinguish Two Report Types
In Odoo implementation, "report" usually means at least two things.
| Type | Examples | Main Usage |
|---|---|---|
| Printable reports | Quotation, sales order, invoice, delivery slip, purchase order, labels | External sending, internal archive, printing with goods |
| Analytical reports | Sales analysis, inventory analysis, purchase analysis, aged receivables, profit analysis | Management decisions, daily checks, business review |
These two types are handled differently.
Printable reports focus on layout, logo, header and footer, terms, field display, and PDF appearance. Analytical reports focus on data definition, filters, grouping dimensions, date range, and permissions.
If a customer says they need a report, the consultant should not jump into a development quote immediately. First ask: is this a customer-facing document or internal business analysis? Is it viewed every day or only occasionally? Can native lists filter it out, or does it require cross-module calculations?
What Native Odoo Reports Can Do
Native Odoo reporting is more complete than many customers expect.
| Capability | Usage |
|---|---|
| Reporting menus in modules | View built-in statistics such as sales, purchase, inventory, and finance analysis |
| Search | Quickly find records by customer, product, status, date, and more |
| Filters | Show only data meeting conditions, such as this month's orders or unpaid invoices |
| Group By | Summarize by salesperson, customer, product category, month, and other dimensions |
| Favorites | Save common filters for quick reuse |
| List view | View detailed data and export Excel or CSV |
| Pivot view | Similar to a spreadsheet pivot table, suitable for multi-dimensional summaries |
| Graph view | Use bar, line, or pie charts to see trends quickly |
| PDF printing | Output standard documents such as quotations, invoices, and delivery slips |
| Document layout | Manage company logo, header, footer, colors, and basic layout |
For self-implementation, learn these native capabilities first. Many "custom report requirements" are really just unfamiliarity with filters, grouping, pivot views, and favorites.
Common Printable Reports
Different modules have their own printable reports.
| Module | Common Reports |
|---|---|
| Sales | Quotation, sales order |
| Purchase | Purchase order, request for quotation |
| Inventory | Delivery slip, receipt slip, picking slip, inventory labels |
| Accounting | Customer invoice, vendor bill, payment receipt, aged report |
| POS | Receipt, session closing report |
| Manufacturing | Manufacturing order, work order, bill of materials |
For a first go-live, do not rebuild every document to match the old system. A safer approach is to confirm the 3 to 5 most commonly used documents first, such as quotation, invoice, delivery slip, purchase order, and receipt slip.
These documents should first satisfy: understandable, correct fields, correct company information, and acceptable to customers. Layout can be optimized later.
Document Layout
Document layout controls the basic appearance of PDF documents such as quotations and invoices: logo, colors, header, and footer.
Configure it from Settings -> General Settings -> Company -> Document Layout.
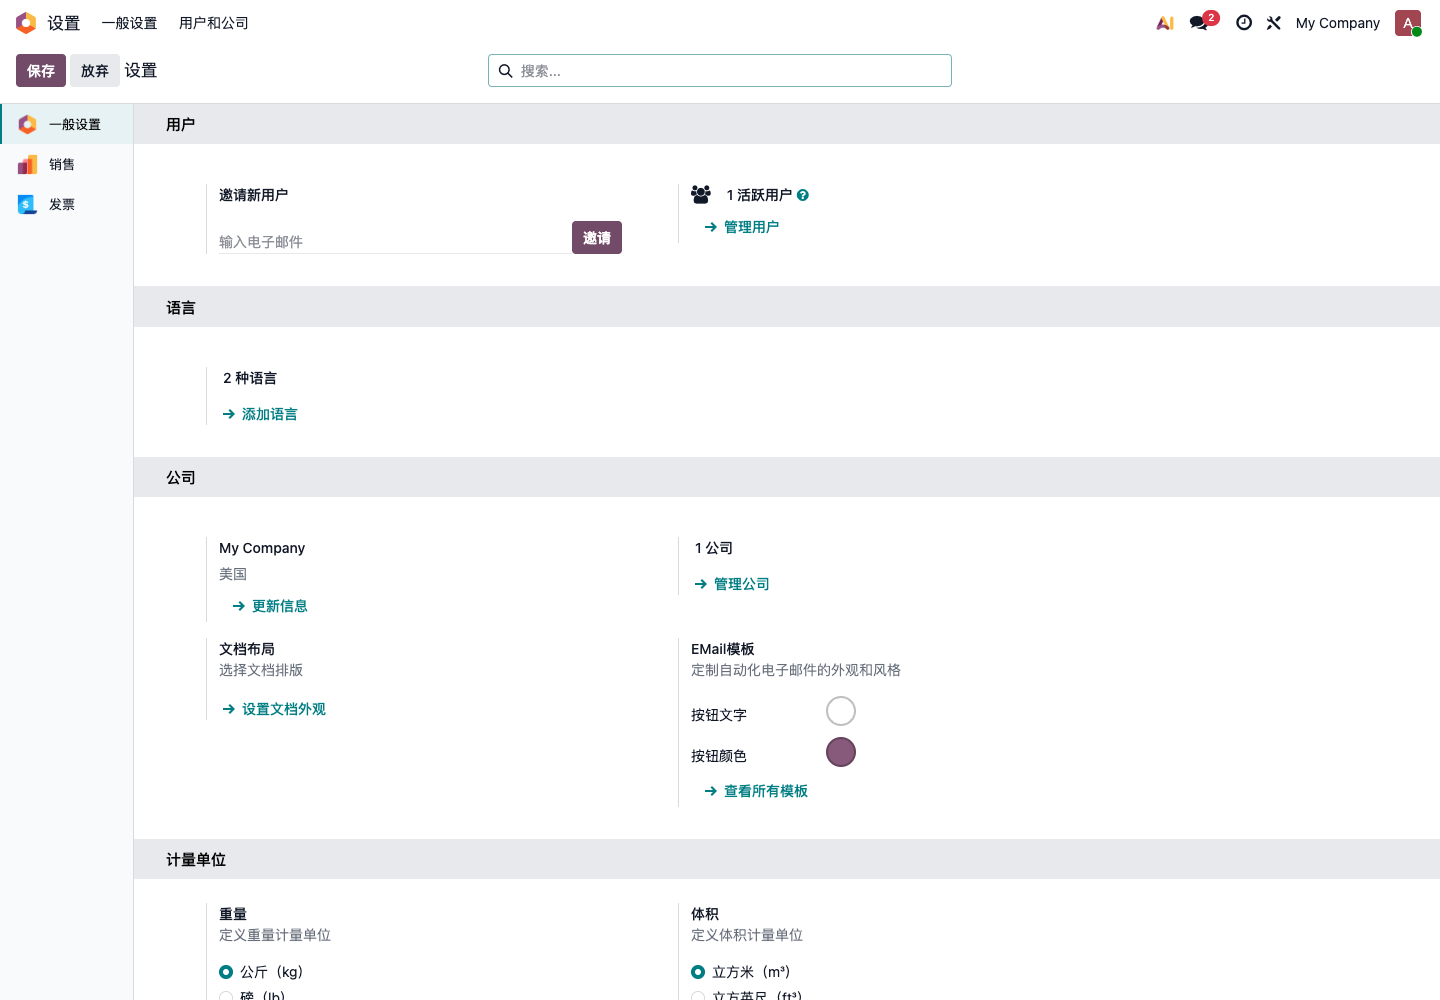
Confirm:
- Is the logo clear?
- Are company name, address, phone, and email correct?
- Does the document color fit the company brand?
- Is footer information correct?
- Are Chinese and English displayed correctly?
- Are quotation, invoice, and delivery slip readable after printing?
Document layout is a global basic setting. Do not change it frequently, especially after quotations and invoices have already been sent to customers.
Where Analytical Reports Are
Most Odoo applications provide a Reporting menu to analyze and visualize business data.
Common entries:
| Module | Common Analysis |
|---|---|
| Sales | Revenue, salesperson performance, product sales, customer sales |
| CRM | Lead count, opportunity stage, win rate, sales team performance |
| Purchase | Purchase amount, vendor purchase, purchase lead time |
| Inventory | Stock quantity, inventory value, receipts/deliveries, product moves |
| Accounting | Receivables/payables, aging, profit and loss, balance sheet, cash flow |
| POS | Store sales, cashier, product sales, payment methods |
| Project | Task status, timesheets, assignee, project progress |
Report names differ by module, but usage is similar: enter the report, then analyze with filters, groups, charts, pivot views, and exports.
Search, Filter, And Group
Before using native reports, become familiar with the search bar.
Odoo search usually supports three operations:
| Function | Usage | Example |
|---|---|---|
| Search | Find records by keywords | Customer name, product name, order number |
| Filter | Limit data range | This month's orders, unpaid invoices, completed tasks |
| Group By | Summarize by dimension | Salesperson, customer, month, product category |
For example, if the owner asks for this month's sales amount by salesperson, a custom report may not be needed. Open Sales Analysis, filter this month, group by salesperson, and view amount totals.
If finance asks which customers still have unpaid invoices, open the invoice list, filter unpaid, and group by customer.
The key is not always development. The key is knowing where the data is, which conditions to filter by, and which dimension to group by.
Save Common Queries As Favorites
Many reports customers view daily are not complex. They only use fixed conditions.
Examples:
- This month's sales orders;
- My opportunities to follow up;
- Overdue unpaid invoices;
- Today's pending deliveries;
- Products below safety stock;
- Quotations from a sales team;
- POS sales from a store.
Use favorites to save these query conditions. Next time, the user can open the same view without reselecting filters.
Favorites are very valuable. They turn "the consultant teaches the customer how to click" into "the customer clicks once and sees it." For self-implementation, this native capability is often underestimated.
Pivot Tables And Charts
Lists are good for details. Pivot tables and charts are better for summaries.
Pivot tables are suitable for:
- Summarizing sales by month, salesperson, and product category;
- Counting purchase amount by vendor and product;
- Viewing receivables by customer and payment term;
- Viewing inventory value by warehouse and product category;
- Viewing timesheets by project and assignee.
Charts are suitable for:
- Whether sales are rising or falling;
- Which product category contributes most;
- Which sales team performs better;
- Which months have abnormal inventory changes;
- Which payment methods have the largest share.
If customers are used to Excel pivot tables, explain Odoo pivot views as "pivot tables inside the system." Many scenarios do not need to export to Excel.
Export To Excel
Odoo supports exporting Excel or CSV from list views.
Suitable scenarios:
- Temporary analysis;
- Sharing with external people;
- Comparing with old systems;
- Finance checking;
- Batch checking master data;
- Data cleaning before go-live.
Do not rely on export for daily management for the long term. If the same table must be exported and manually processed every day, it usually means one of two things:
- Native filters, grouping, favorites, and pivot views are not being used well;
- This report has become a fixed management need and should be redesigned as an in-system report or dashboard.
Export is a useful helper, but it should not become the company's daily management process.
Data Definition Matters More Than Layout
The most important part of a report is not style, but data definition.
For example, "sales amount" can mean:
- Quotation amount;
- Confirmed sales order amount;
- Invoiced amount;
- Paid amount;
- Tax excluded amount;
- Tax included amount;
- Based on order date;
- Based on invoice date;
- Based on payment date;
- Excluding canceled orders;
- Including or excluding freight and discounts.
If the definition is not clear first, even a beautiful report will be considered inaccurate.
Confirm key indicators first:
| Indicator | Questions To Confirm |
|---|---|
| Sales amount | Order, invoice, or payment? Tax included or excluded? |
| Gross margin | Where does cost come from? Standard cost, average cost, or actual cost? |
| Inventory value | Which costing method? Is inventory valuation enabled? |
| Receivables | Invoice balance or customer balance? Which date is used for aging? |
| Purchase amount | Purchase order or vendor bill? Tax included or excluded? |
The owner, sales, finance, and warehouse may understand the same word differently. The first step of report implementation is aligning language.
Why Native Solutions Come First
The best reporting solution is usually to use native Odoo first.
| Native Advantage | Description |
|---|---|
| Lower upgrade risk | Native views, search, reporting menus, and QWeb reports upgrade more easily |
| Consistent permissions | Native reports follow Odoo model access, record rules, and company permissions |
| Real-time data | Directly based on business data without extra synchronization |
| Lower learning cost | Once users learn filters, groups, and favorites, they can reuse them across modules |
| Lower maintenance cost | No extra report engine or plugin to maintain |
| Easier troubleshooting | Data source, fields, and permissions are inside Odoo |
There are many report plugins, BI plugins, drag-and-drop report designers, and external dashboards on the market. They are not unusable, but they should not be the first choice.
Common issues:
- Extra plugins increase maintenance cost;
- Plugin compatibility depends on specific Odoo versions;
- Plugins may rewrite native report engines or frontend components;
- Upgrades require separate migration and testing;
- Permissions, company, currency, language, multi-website, and other rules may not match native Odoo logic;
- External BI needs data synchronization and may show numbers different from Odoo;
- If the plugin author stops maintenance, later upgrades can be blocked.
Our recommendation: use native first, customize only when native is not enough; if QWeb and native views can solve it, do not introduce heavy report plugins first; if filters and groups can solve it, do not start development immediately.
When Custom Reports Are Needed
Consider customization when:
- A fixed format is required;
- Government, customs, or platform requires a specific format;
- PDF documents must match an industry layout;
- Management needs a cross-module dashboard;
- Native fields cannot satisfy the statistical definition;
- Complex calculations are needed, such as rebates, commissions, or margin allocation;
- Data from multiple systems must be combined;
- Different templates must be generated by customer, channel, country, or business type.
Before customization, confirm:
| Question | Description |
|---|---|
| Who reads it? | Owner, finance, sales, warehouse, or customer |
| What is shown? | Indicators and fields |
| How is it calculated? | Statistical definition |
| How often is it viewed? | Real-time, daily, monthly |
| Data source | Sales, inventory, finance, or external systems |
| Output format | PDF, Excel, chart, dashboard |
| Permission boundary | Who can see it and who cannot |
| Upgrade impact | Whether native reports are modified or third-party plugins are required |
Report requests without definitions should not be developed immediately. Write the definition first, then evaluate native features, QWeb customization, server actions, view extension, or external BI.
Boundary Of Printable Report Customization
Printable reports are usually based on QWeb templates. QWeb is Odoo's native PDF reporting technology and is suitable for quotations, invoices, delivery slips, purchase orders, and similar documents.
Suitable light adjustments:
- Add fields;
- Adjust header text;
- Modify footer terms;
- Adjust logo and company information;
- Add customer reference, contact person, or delivery notes.
Needs careful evaluation:
- Rebuilding the entire layout;
- One template per customer;
- Complex multi-language, multi-currency, multi-company templates;
- Many conditional branches and complex calculations;
- PDF merge, encryption, preview, stamping, cloud printing, and similar extensions.
Light adjustments are usually stable. Heavy customization must consider future upgrades and maintenance. Do not block the native upgrade path just to make Odoo look exactly like the old system.
Different Report Styles By Customer
Standard Odoo usually configures document layout by company. This is the safest phase-one approach. In some projects, customers may want different report styles, company slogans, headers, footers, or special terms for different customers under the same company.
This requirement usually belongs to report enhancement or customization.
In Ohm Network's base solution, custom report configuration can provide more detailed report style control. It does not replace native Odoo reports; it enhances the native report mechanism.
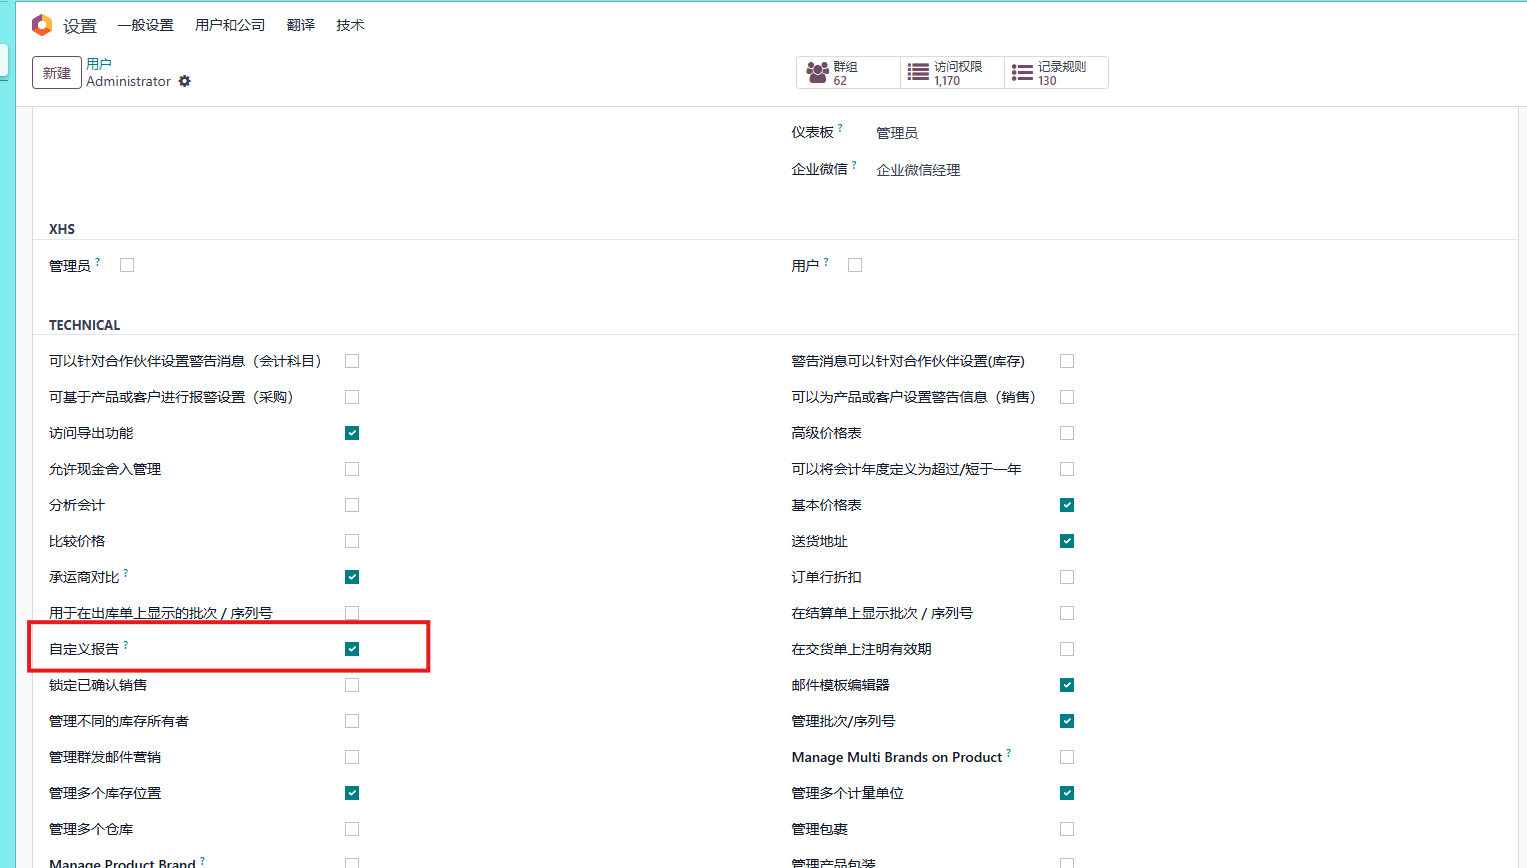
First, enable custom report configuration permission in user settings.
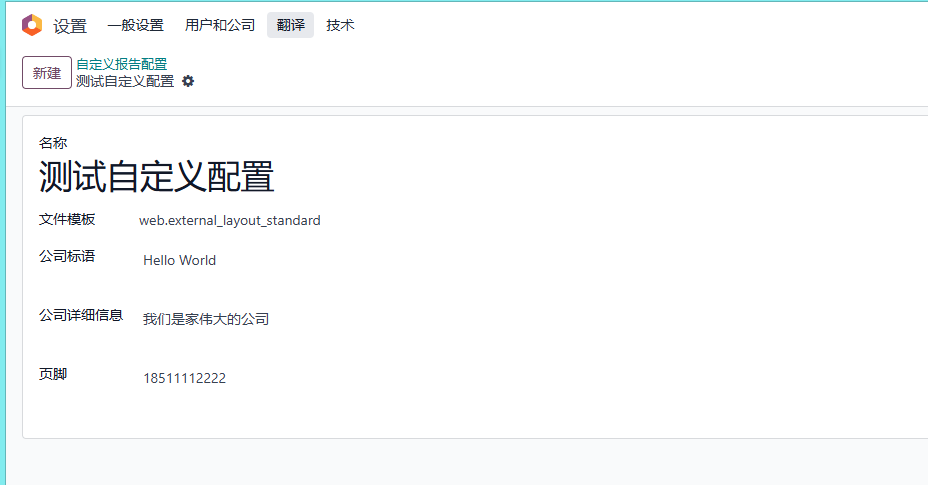
Then create custom report configuration from technical settings.
Next, assign a report configuration on the customer record.
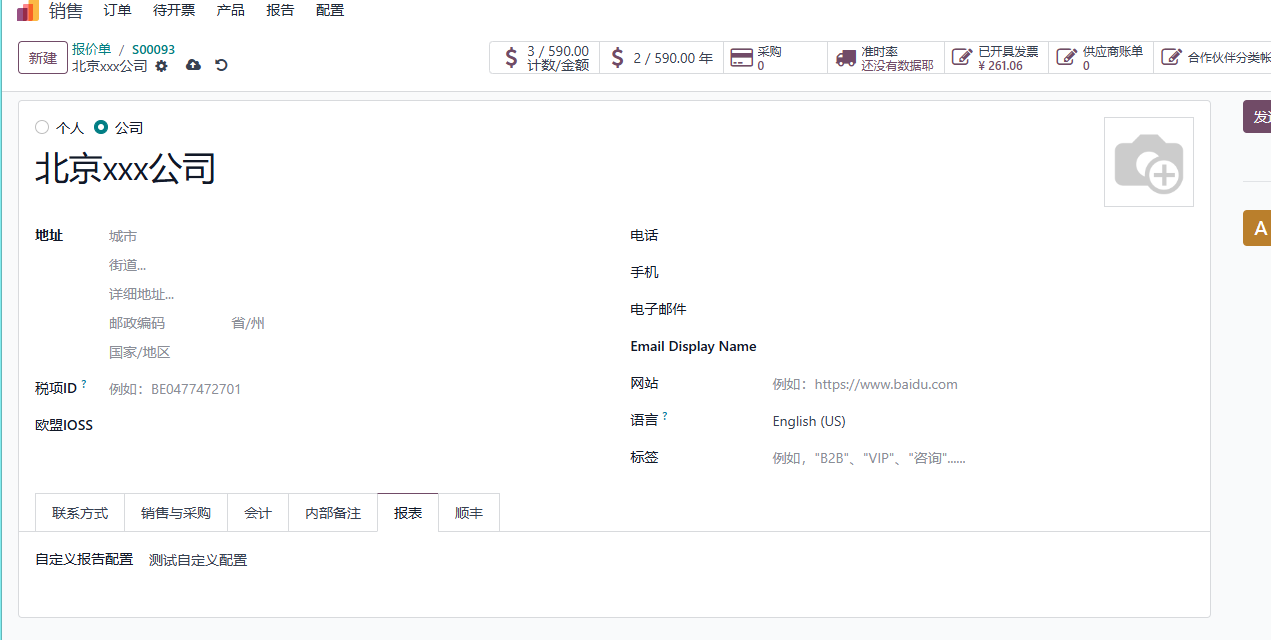
When printing that customer's document, the specified style is used.
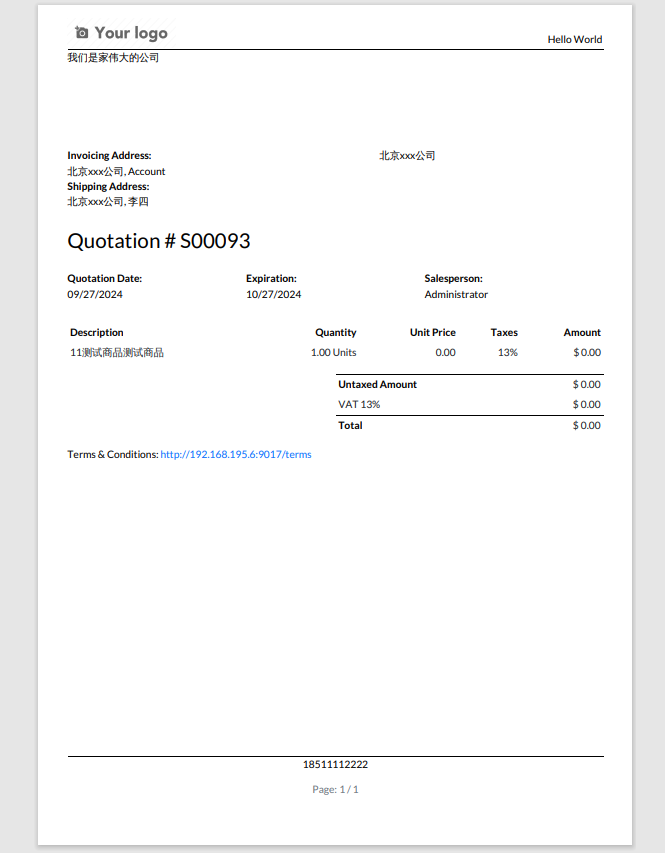
This is suitable for:
- One company serving multiple branded customers;
- Different customers requiring different footers or terms;
- Foreign trade customers needing different languages and styles;
- Group companies needing one system with different external documents;
- Agents or channel customers requiring dedicated document formats.
Implementation advice remains the same: run the process with native reports first, then configure or customize report differences that truly create value. Do not build separate reports for every customer from the beginning.
Implementation Advice
Report implementation can follow this sequence:
| Stage | Recommendation |
|---|---|
| Stage 1 | Use native PDF documents and document layout; confirm key documents such as quotations, invoices, and delivery slips are usable |
| Stage 2 | Teach users search, filters, grouping, favorites, and export |
| Stage 3 | Use Reporting menus, pivot views, and charts to answer daily business questions |
| Stage 4 | Confirm key indicator definitions with management, sales, and finance |
| Stage 5 | Customize or enhance only reports that native features cannot satisfy and that have clear value |
For self-implementation customers, do not start with big screens, dashboards, or drag-and-drop designers. First let each role see the data they need every day in Odoo, then let management confirm a few key indicators, and finally discuss complex reports.
This chapter covered native Odoo reports, PDF documents, search and filters, grouping and favorites, pivot views, charts, export, report definitions, and customization boundaries. At this point, the basic data, email, messages, and reports in Part 2 are mostly ready. The next part moves into Sales Management and begins the complete business flow from quotation to order.